The Challenge
Complex contracts.
Hidden opportunities.
Energy contracts combine pricing, volumes, dates, and customer information. Traditional tables hold the detail, but make geographic relationships and overlapping locations difficult to explore.
When several contracts share a location, a single point on the map can hide multiple opportunities.
-
Geographic context
See contract locations and the relationships between them.
-
Opportunity indicators
Color-coded markers provide a visual opportunity scale.
-
Flexible exploration
Filter, rank, and sort the contracts in view.
-
Contract details
Connect a location to contract information and market comparisons.
The Solution
Contracts on a map.
Opportunities at a glance.
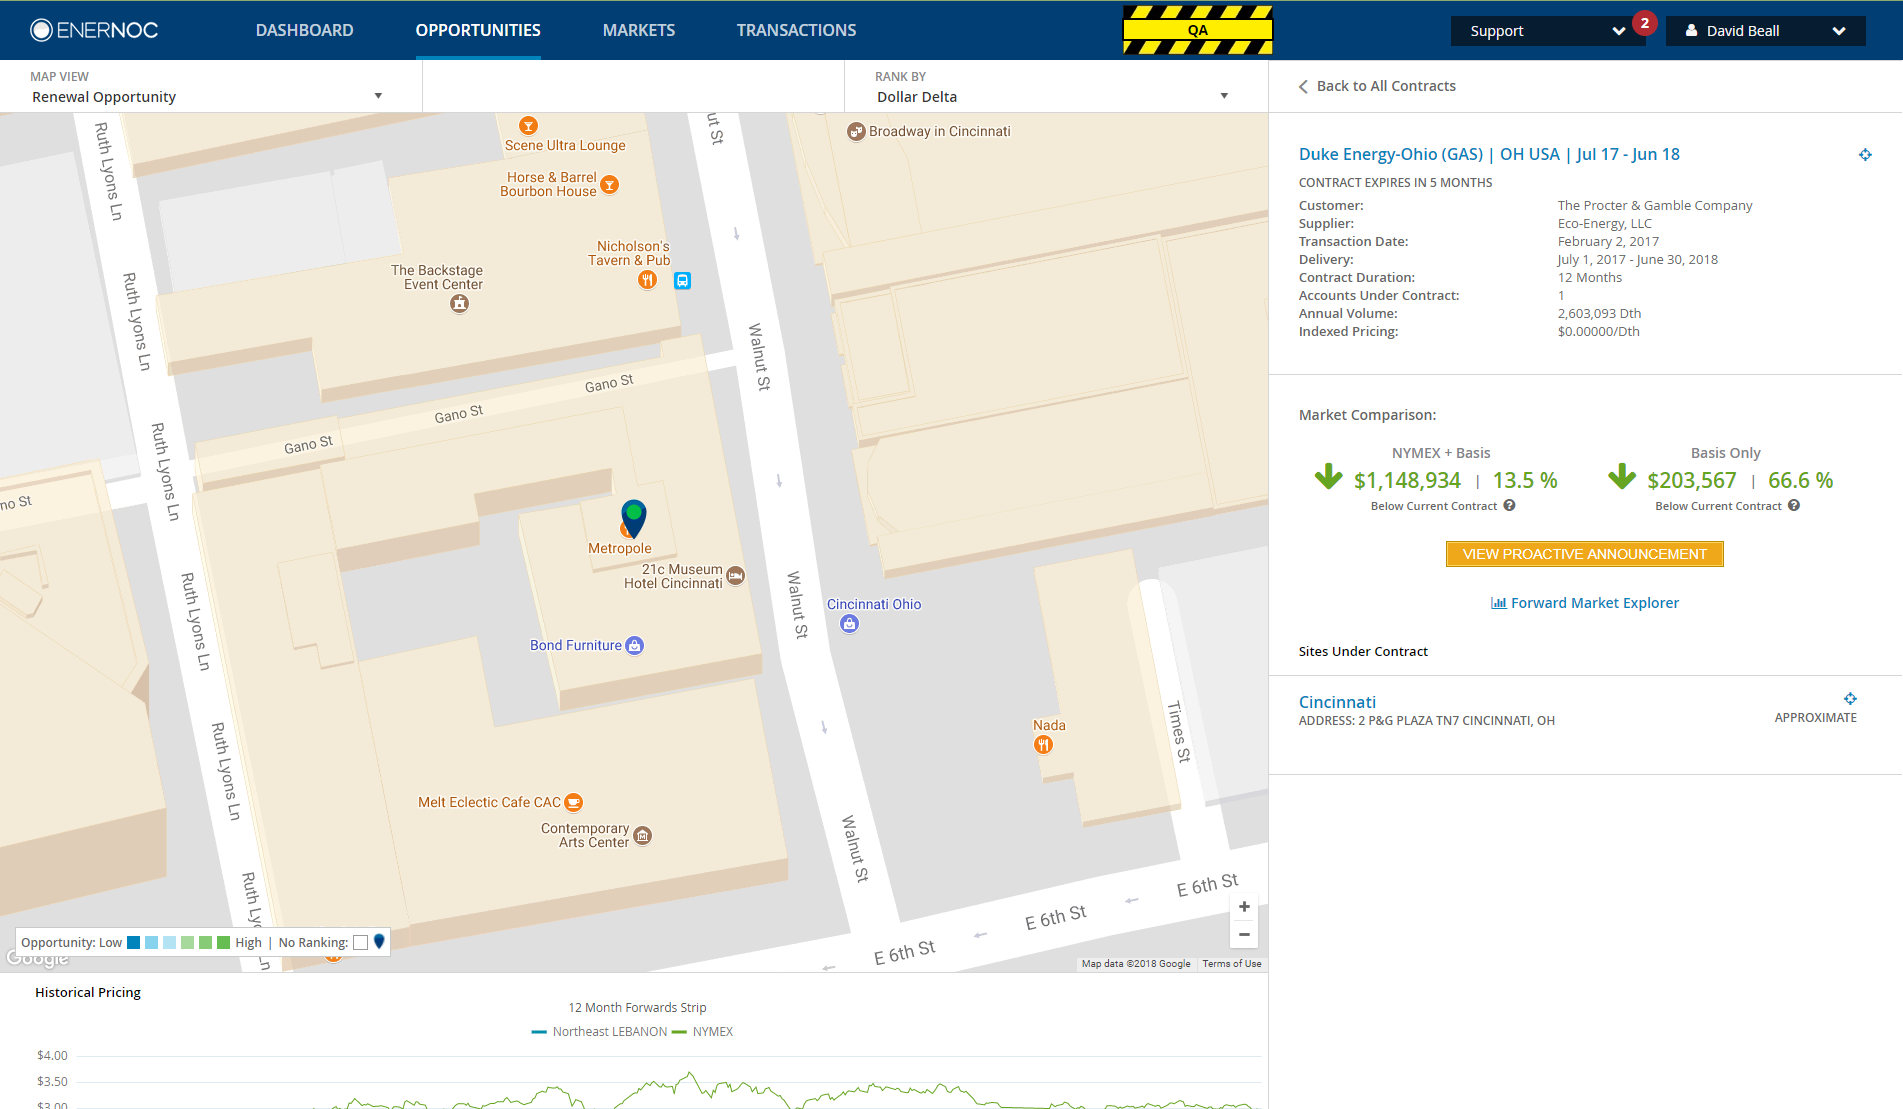
Geographic context brings contract locations into view. Filters, ranking, and sorting help focus the exploration, while colored markers indicate relative opportunity on the map’s low-to-high scale.
Selecting a contract connects the map to its detail panel: customer and supplier information, dates, volume, and market comparison. Historical pricing provides another perspective below the map.
The Interaction
Making every opportunity accessible.
Multiple contracts at the same location caused overlapping map markers. I implemented a spidering interaction, adapting an existing approach to spread those markers into individually selectable pins while retaining a connection to their shared location.
The demo below illustrates the interaction. The original screenshot beside it shows the expanded markers in the actual EnerNOC interface.
Explore the spidering interaction
Conceptual demo · Example pins, not original product UI or contract data.
Six example pins share one location. Expand the pins to reach each one.
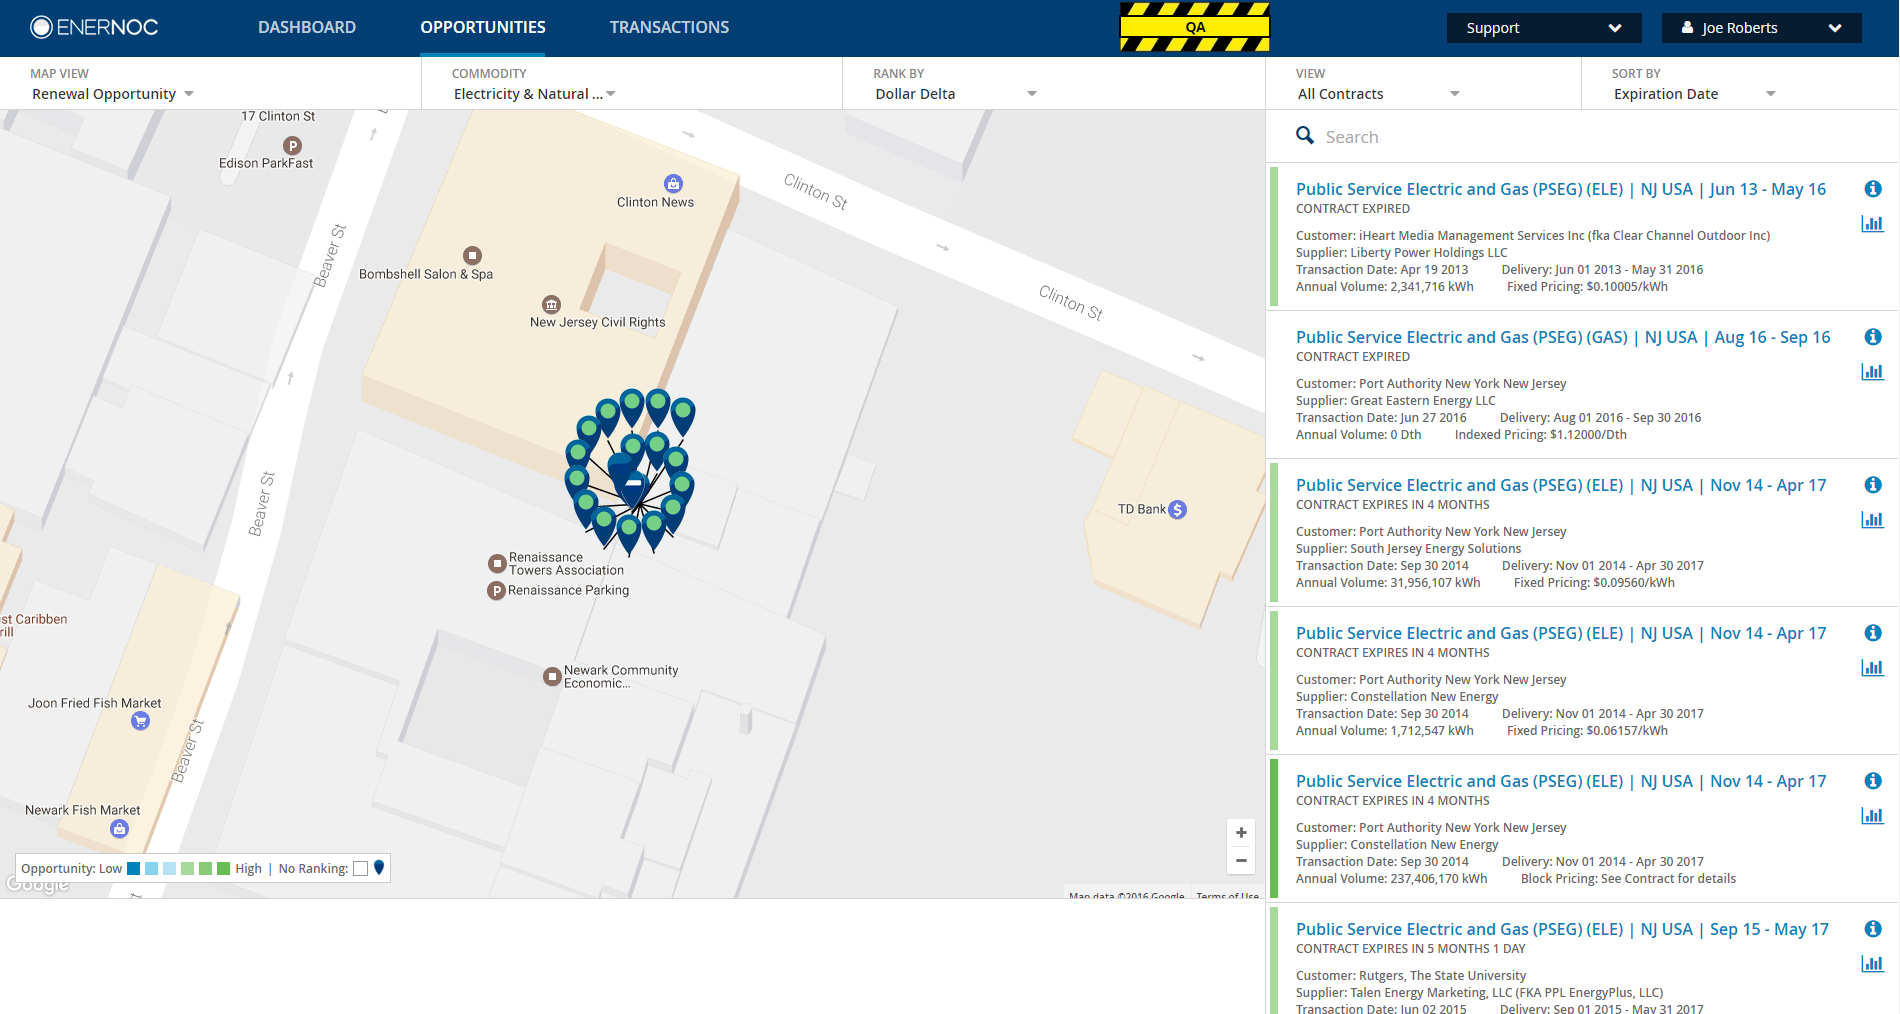
Original product evidence. Contract names, figures, and locations are preserved as captured.
My Contribution
Engineering
interactive experiences.
I worked on frontend implementation, Google Maps integration, custom marker clustering and spidering, filters, contract details, and market-comparison views.
I collaborated with Product, UX, and backend engineering to connect complex contract data with an interface for exploring it geographically. I adapted existing spidering behavior to the application’s marker interactions.
-
Google Maps integration
Frontend integration of the map and contract locations.
-
Custom marker interactions
Clustering and spidering behavior for overlapping markers.
-
Contract exploration
Filters, contract details, and market-comparison interfaces.
-
Collaboration
Working with Product, UX, and backend engineering.