The Challenge
Complex energy markets.
Real-world decisions.
Energy analysis brings together prices, contract terms, forecasts, and periods. The challenge is to make those dimensions understandable while preserving the detail needed for comparison.
A useful interface must support both a broad view of patterns and a closer look at the underlying numbers.
-
Large data sets
Prices, contract terms, and periods in the same analysis.
-
Multiple perspectives
Historical trends, forward prices, budgets, and positions.
-
Flexible analysis
Filters and chart settings that keep comparisons focused.
-
Diverse users
Different questions call for different views of the data.
Market Exploration
Find patterns.
Compare opportunities.
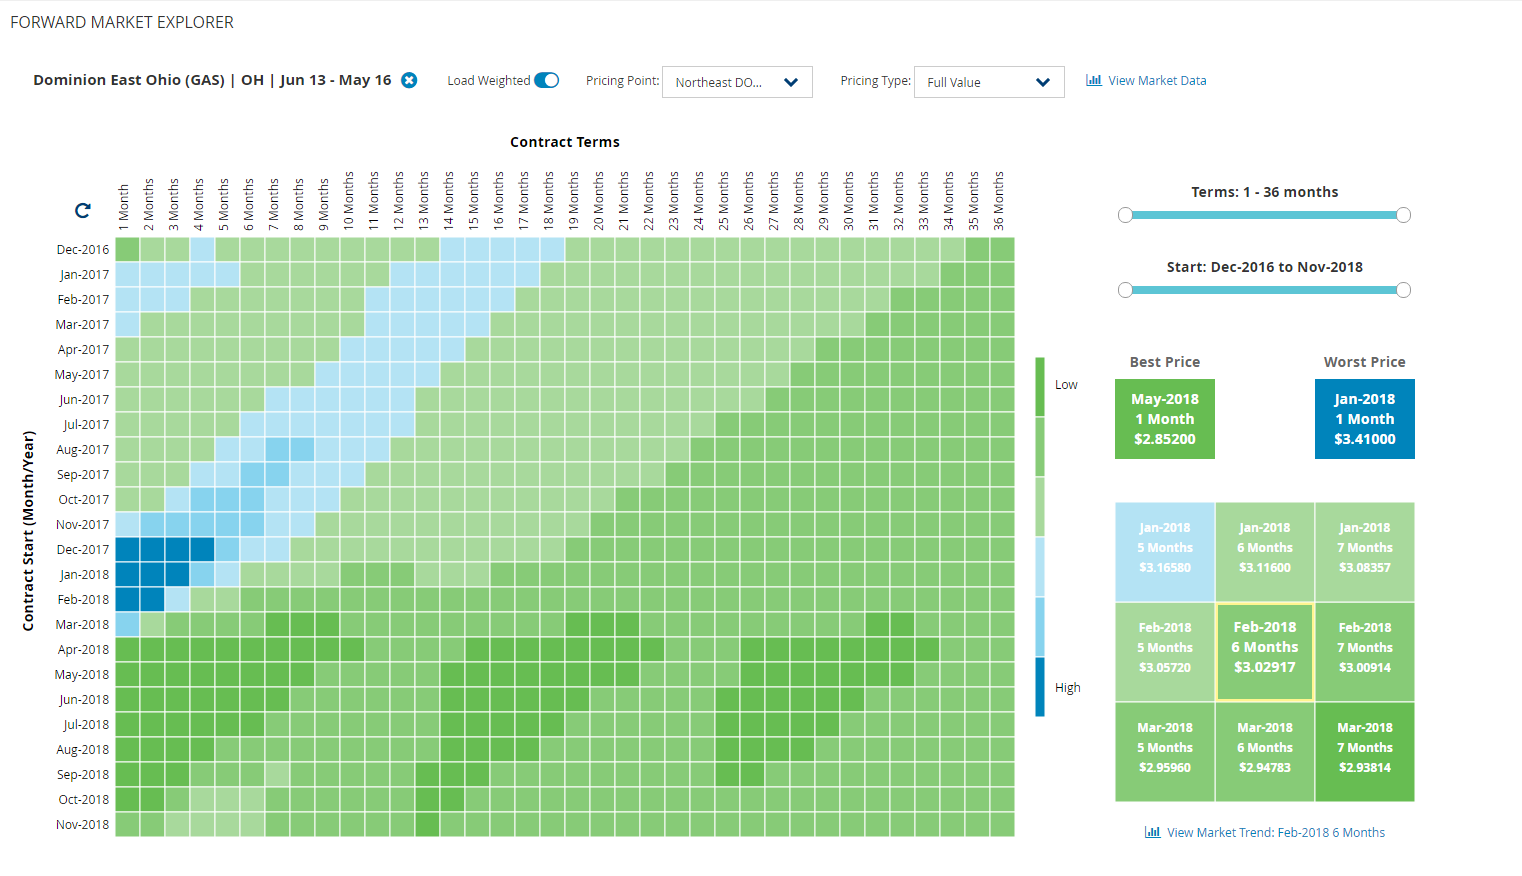
The Forward Market Explorer organizes prices by contract start and term. A heatmap makes the relationships visible, while filters and price summaries offer more focused comparisons.
From overview to detail
Compare contract terms.
Adjust pricing perspectives.
Explore historical trends.
Configurable market charts
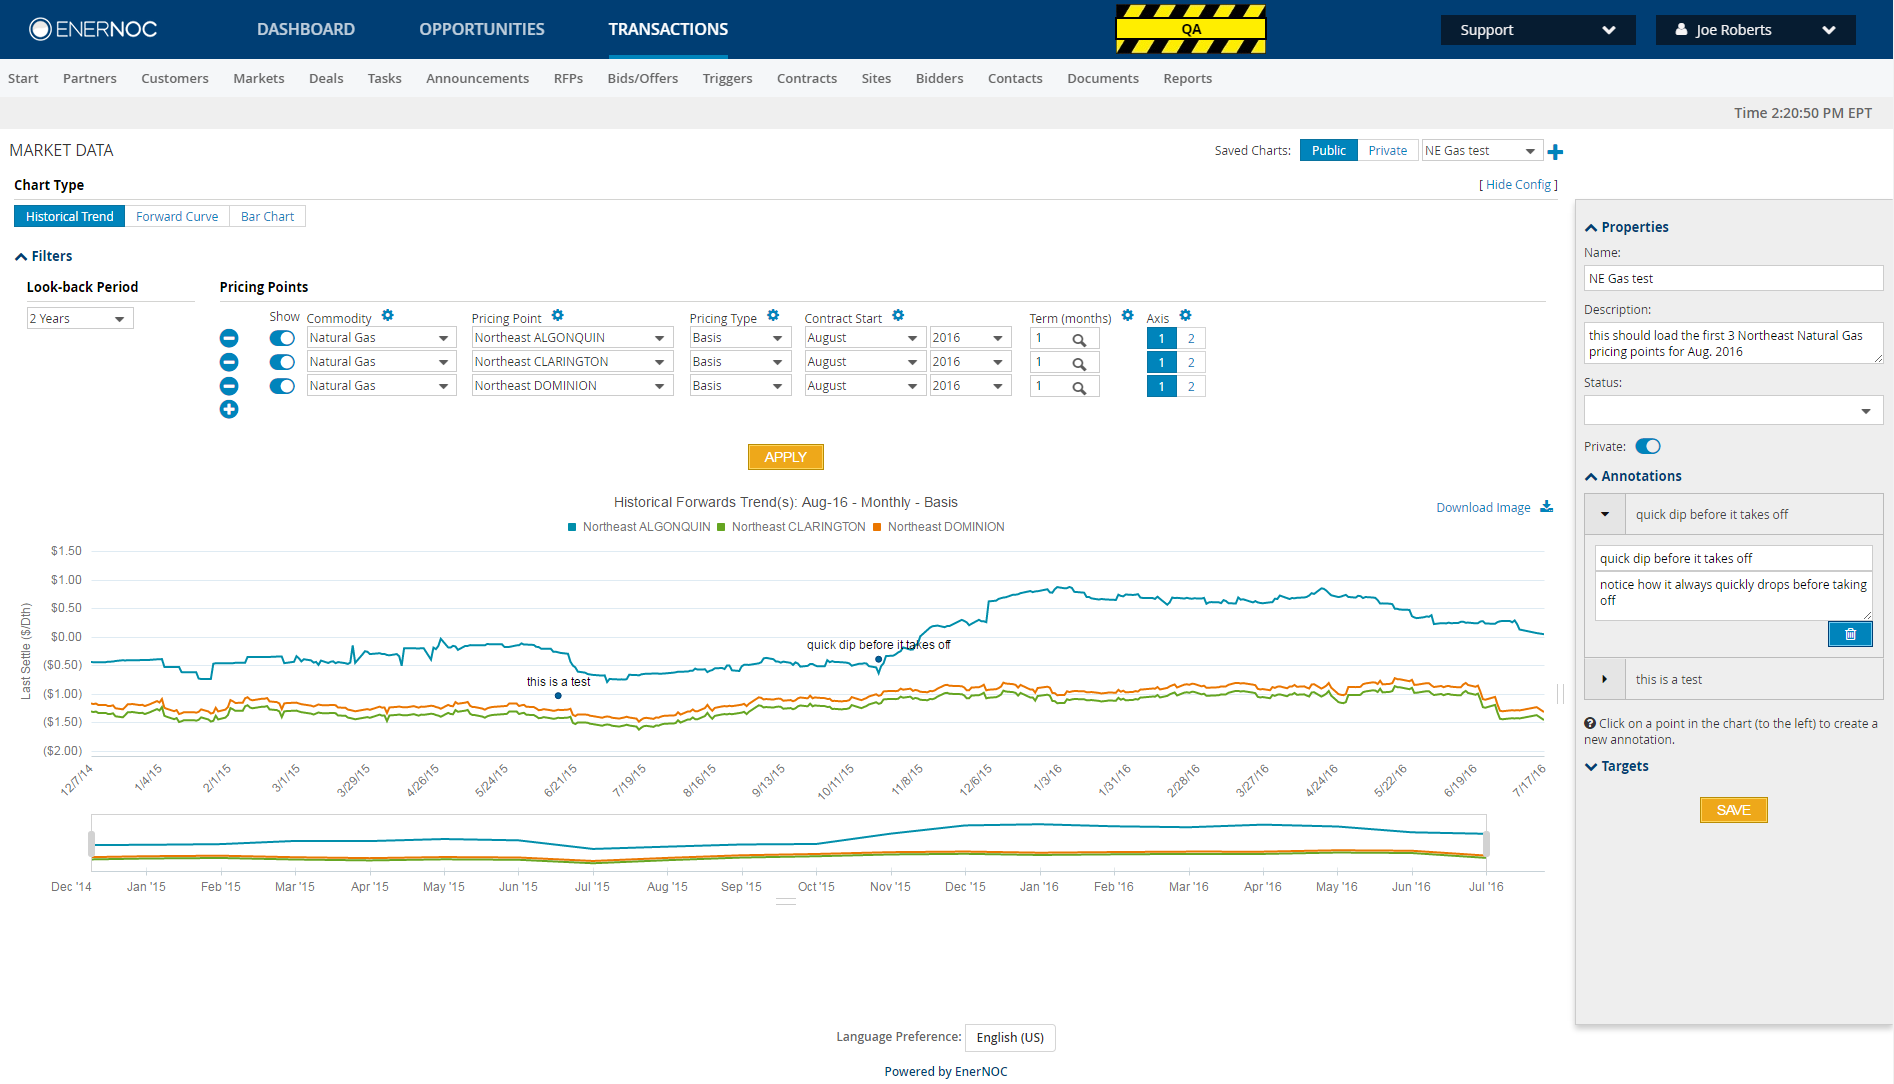
Chart types and pricing-point settings bring different market perspectives into a common view. The original chart includes historical series, a time-range navigator, and annotations beside the visualization.
Reporting and Analytics
From numbers to insights.
Reporting brings filters, tables, and charts together. These original interfaces connect the detailed values with visual summaries of costs, usage, hedges, and forecast volume.
Budget report
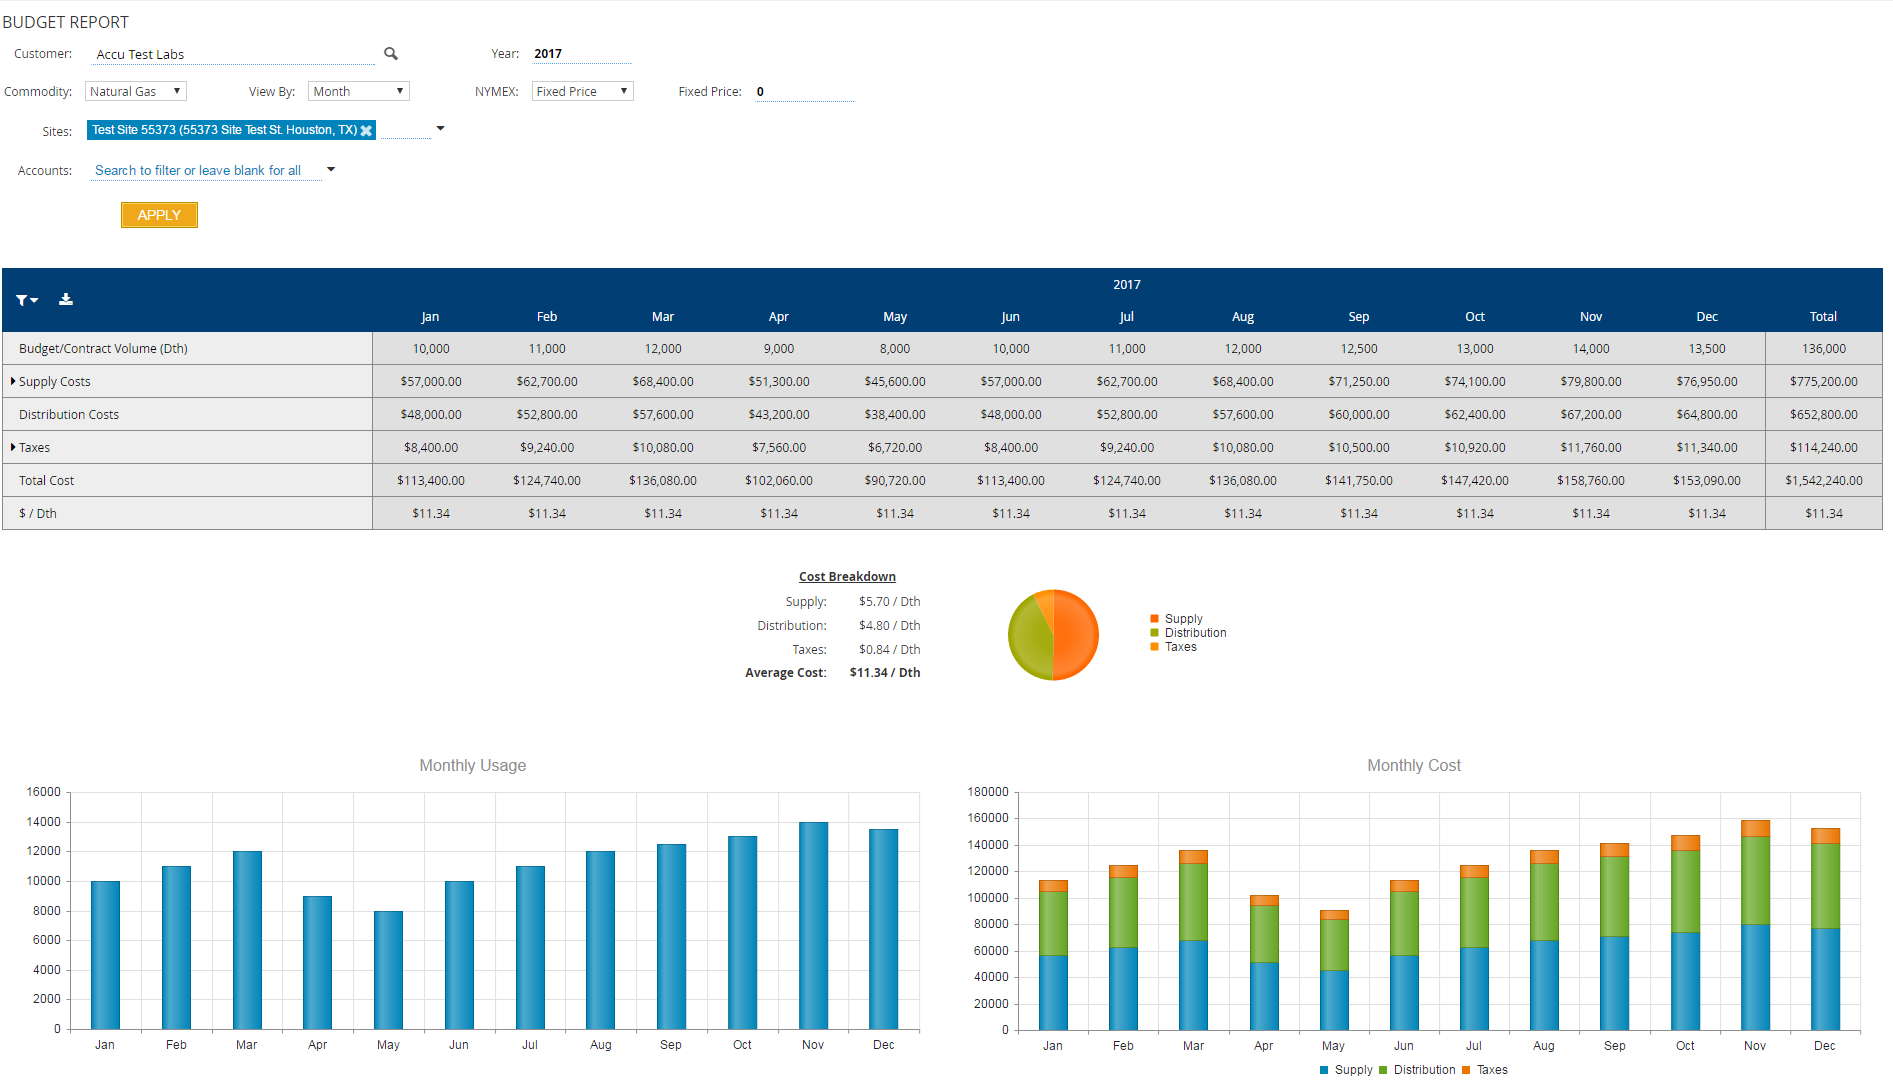
Customer, year, commodity, and site filters sit above monthly cost and volume tables. Usage, cost breakdown, and monthly cost charts offer complementary views of the same report.
Electric position report
Contract and site views, date ranges, and hedge-status filters frame a comparison of purchased and proposed hedges with forecast volume. The table below provides the detailed contract values.
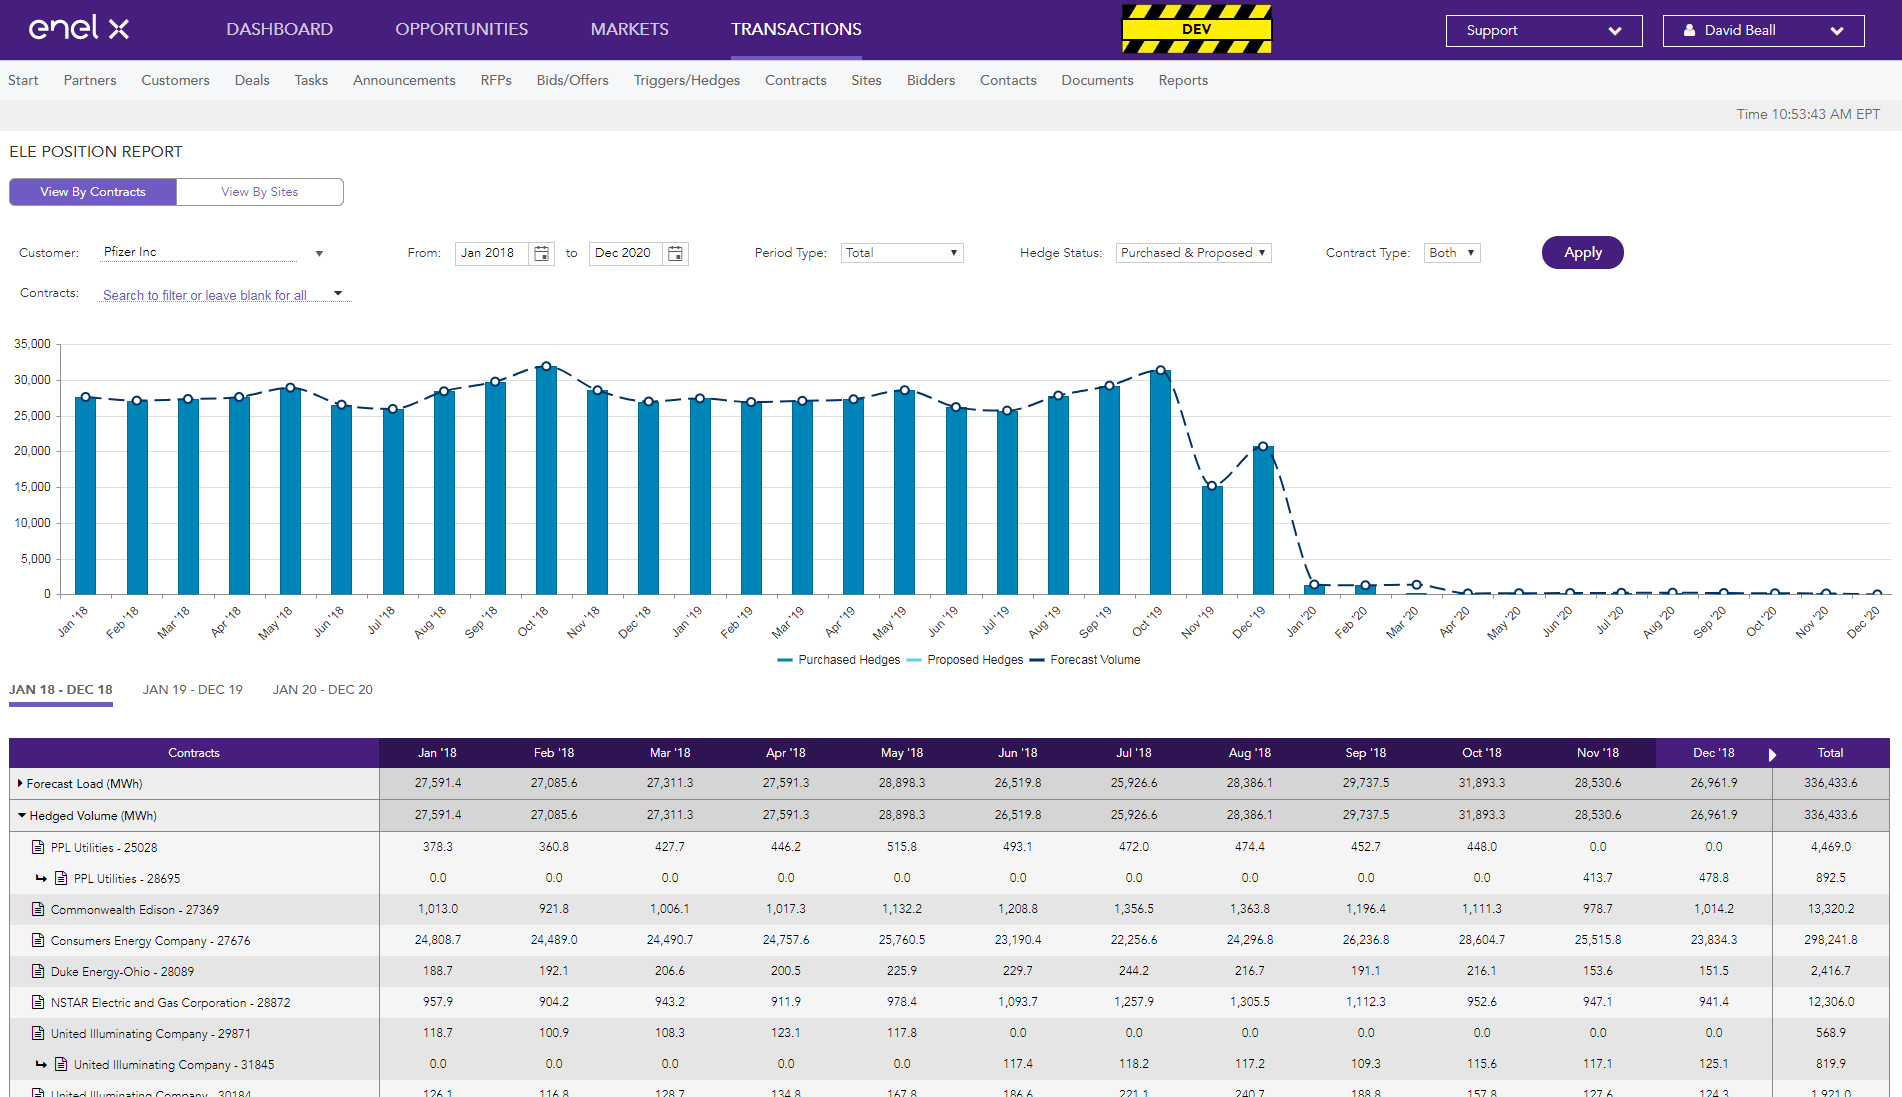
Original product screenshots. Values and dates belong to the captured interfaces.
My Contribution
Engineering
data-driven experiences.
As frontend technical lead at Enel X / EnerNOC, I worked on enterprise energy management applications with Product, UX, and backend engineering. My work included frontend architecture, reusable components, chart visualizations, dashboards, and reporting tools.
These market reports were built with AngularJS, Kendo UI, and ASP.NET.
-
Frontend architecture
Modular application structure and shared engineering patterns.
-
Visualization engineering
Interactive charts, heatmaps, and reporting interfaces.
-
Reusable components
Common UI patterns across complex enterprise applications.
-
Product & UX
Close collaboration to explore and prototype ideas.